Air and Ocean: Logistics Challenges & Trends in [2021]
The global pandemic outbreak has been an extremely difficult moment for the logistics sector, the demand shock which started in 2020 had its ripple effect continued in 2021 and some would say that it is perhaps the world’s first instance of the supply chain being disrupted on such a large scale across the year.
With creative pivots and operational tweaks, we made it through 2021. Many supply chain constraints will exist in 2022, ranging from capacity restrictions to rising complexity.
In this logistics summary report 2021, we reviewed all of the significant supply chain shocks from January 2021 to December 2021, along with all logistics industry trends confronting the sector in the previous year.
Table of Contents
2021 Monthly Ocean Freight Updates at a Glance
January 2021
- From the initial 2020 shock, strong cargo demand continues especially from China while equipment shortage persist
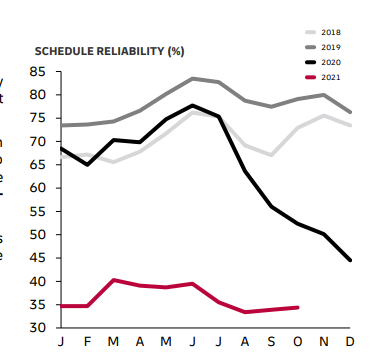
- Ocean schedule reliability deteriorating due to trade imbalance
- Massive delays at Ports in East and West Trade with a high number of vessels waiting at anchorage to berth
- The severe equipment imbalance to last until the end of Q1, 2021
- Pre Chinese new year rush is around the corner and the equipment situation continues to be critical.
- Shortage of all container types across Asia continues to be a challenge.
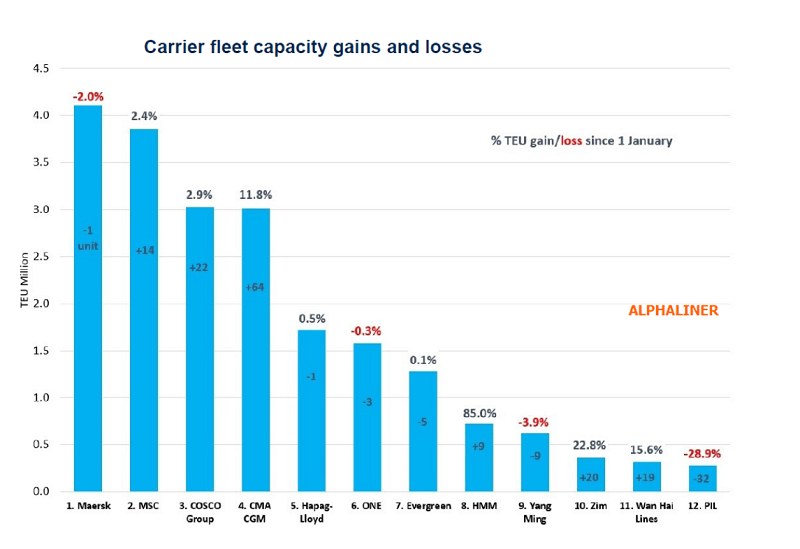
In 2020, eight of the top twelve carriers have grown their fleet.
February 2021
- The combination of high demand and COVID – 19 mitigation measures have impacted and slowed down port operations.
- Truck drivers are forced to leave earlier would they want to see their families this holiday.
- Ocean Vessel Schedule reliability is at an all time low
- The port congestion in the US creates a severe bottleneck
- The lack of empty equipment remains a major issue
- Freight rates are still on a historical high level.
March 2021
- Heavy Port Congestion and Vessel Delays Worldwide Continues
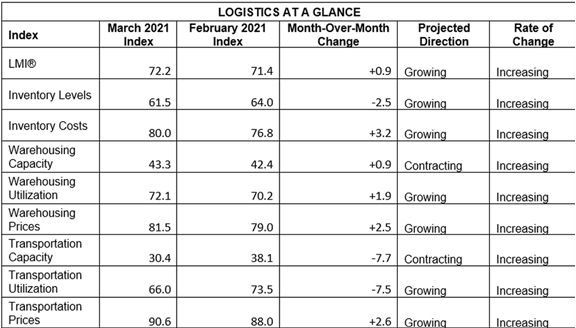
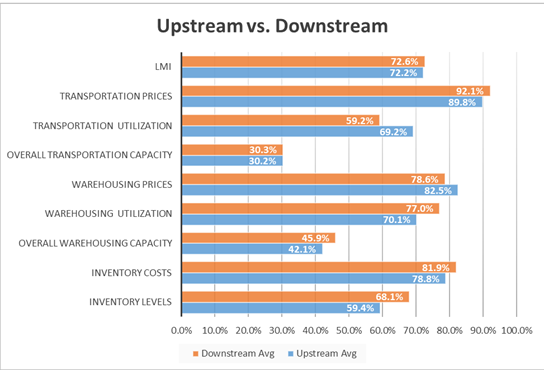
- Record-high Warehousing Prices, tight capacity, and an overall LMI of 72.2, up (+0.8) which is the third-highest reading in the history of the index.
- The major logistics disruption and story had of course been the 6-day blockage of the Suez Canal.
- The disruption in the Suez only exacerbates the continued slowness in west coast U.S. ports
- Peak Season and Equipment Imbalance worsening.
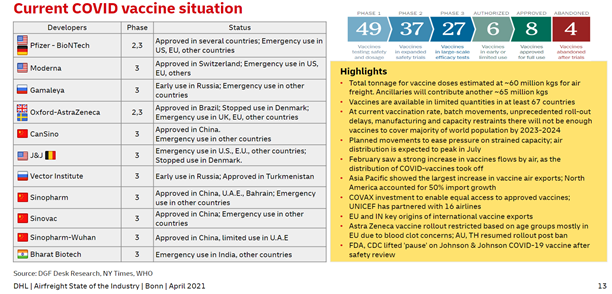
- Vaccination rollouts are progressing, particularly in the United Kingdom.
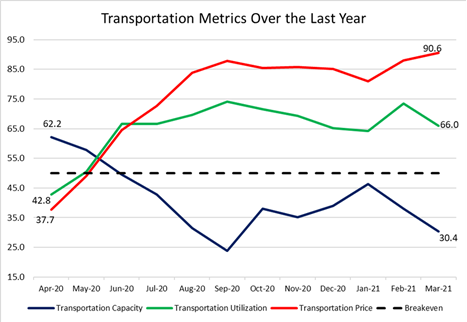
Upstream firms such as 3PLs or carriers (represented by the blue bars) reported a significantly higher rate of Transportation Utilization than downstream firms (represented by the orange bars).
April 2021
- Due to the Suez Canal incident further delays and congestion are expected.
- Industry challenge initially caused by the pandemic and now aggravated by the Suez Canal incident.
- Space remained tight as the increasing backlog at ports resulted from blank sailing/port omission/sliding.
- Severe shortage of semiconductors
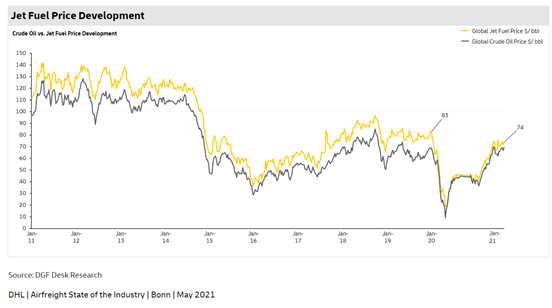
- Jet fuel price ended at around $71/b in April
- Empty containers coming back to Asia are delayed and import returns are lower
Also Read: 3 Trends Facing The Cold Chain Industry
May 2021
- Suez Canal Blockage pushes freight rates further upwards
- Congestion at ports remains a big problem in the US
- The space situation remained tight in May with further blank sailings and vessel delays due to port congestion and equipment imbalance situation remained deteriated
- Jet fuel price touched $75/b but ended at around $74/b in May.
June 2021
- Freight rates reach an all-time high on east west trade
- Demand remained high and carriers had full utilization for June.
- China’s Yantian port situation had a negative effect on scheduling and equipment availability.
- The Yantian port disruption had a wider effect, impacting voyages to most global destinations.
- Equipment shortages remained an industry-wide challenge in the Asia Pacific.
- Heavy port congestion in Europe led to additional infrastructure constraints, while the empty equipment situation further worsened globally as vessels didn’t rotate timely.
July 2021
- New Delta Varient COVID-19 virus breakouts in Shenzhen (Yantian) caused temporary restrictions on export goods, prompting container yard and hinterland congestions, with up to 84 vessels waiting to dock outside the port.
- The disruption caused by the “Ever Given” blocking the Suez Canal came in just before the upcoming peak season.
- The USA has experienced extreme capacity issues affecting downstream rail, trucking and chassis situation.
- Manufacturers in Europe and North America were most affected by delivery delays.
- In Asia, Demand has increased as the COVID-19 situation in India improved.
August 2021
- MSC has been the fastest growing operator in 2021 in terms of actual slots (+177,691 TEU)
- Rates generally continued to trend upwards as demand remained strong.
- Container vessels newbuilding prices soar and order are coming in as we are expecting a hockey stick recovery after the pandemic
- Yantian port stopped container drop-offs due to typhoon In-Fa alert
- Labour shortages and lower productivity at ports in areas hit by the Delta Variant.
September 2021
- Port congestion problems worsen again around the globe
- Vietnam’s extended COVID-19 lockdown has seen import cargo pile up due to factory closures.
- Ocean Carriers have booked and purchased extra boats, as well as additional equipment, in an effort to cool off the overheated freight market. This market is expected to last through 2022.
- In September, temporary lockdowns, ad hoc port closures, labor change concerns, shipyard delays, and other factors can all have an influence on supply chain efficiency.
October 2021
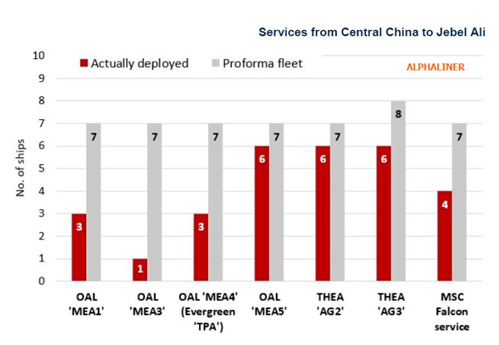
- Dedicated Far East and Middle East services appeared worst hit by the capacity shift to the big profitable East–West trades
- Semiconductor shortages continue to depress global auto production, resulting in depleted dealer inventories and reduced sales
- Jet fuel price reached $96/b in Oct 21; high prices likely to affect already slow belly capacity recovery
November 2021
- US port and infrastructure update North Europe port congestion, due to ongoing significant port congestion in the United States, port officials have implemented additional restrictions and penalties for idle containers.
- Chassis and Equipment Shortages Due to the massive influx of Ocean import cargo, particularly from the Asia Pacific. As a result, containers remain on chassis for substantially longer periods. Both LCL and FCL products were affected.
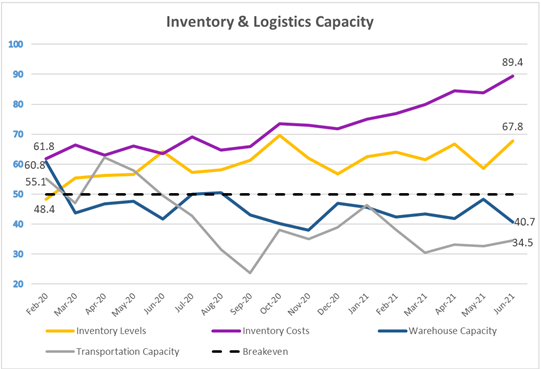
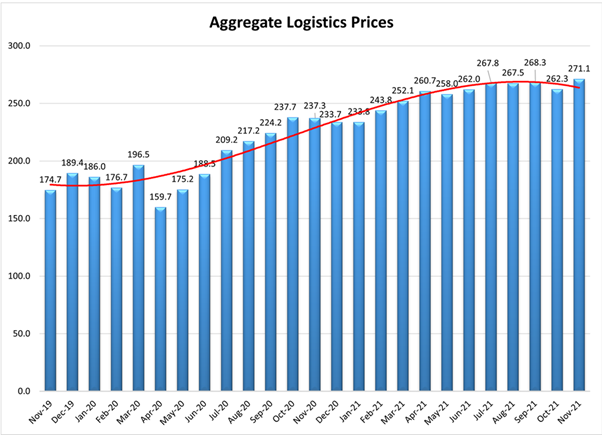
- The aggregate prices function on a scale of 0-300, and in November 2021 they read in at an all-time high of 271.1 – up (+8.8) from October 2021
- Carriers skipped more European ports to cope with delays
December 2021
- The new Omicron Covid-19 variant which is raising concerns about the effectiveness of worldwide efforts to control the virus.
- Vessel congestion outside the ports in China and Europe has decreased.
- Driver shortages are at record levels across the US, and the situation is only going to get worse next year.
- Reliability further decreased on the Transpacific MoM to 10.1% but increased on the Asia to US East Coast to 15.6%. The Asia-Europe and Asia-Mediterranean to 20.5% and 31.5% respectively. It also difficult to measure the reliability of liner services
2021 Monthly Air Freight Updates at a Glance
January – March 2021
- Capacity of Asia Pacific airlines is particularly tight due to countries still under lockdown
- (Cargo Tonne Kilometres ) CTKs deteriorated in Europe and Latin America
- International load factors were the lowest amongst all regions and International cargo volumes reported by carriers in the Middle East fell by 2.2% yoy in November 2020
- Airlines based in the Middle East posted a 9.5% drop in their international CTKs in 2020 compared to 2019.
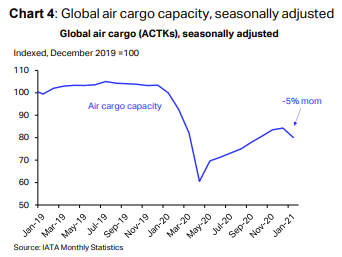
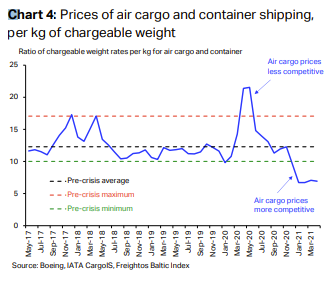
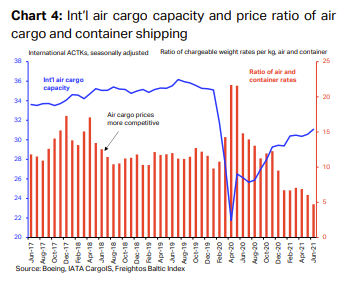
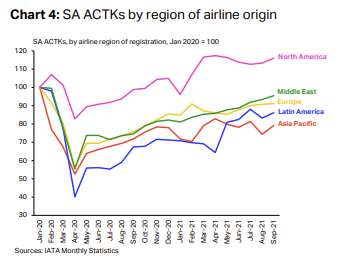
- The industry-wide available cargo tonnekilometres (ACTKs) fell by 5% month-on-month in January – the first monthly decline since the recovery from the crisis started in May (Chart 4).
- The Africa region showed the fastest expansion in Feb
- Global air cargo volumes reached an all-time high in March amid an improving macro-economic backdrop.
- Int’l CTKs of European and Asia Pacific airlines hovered close to the pre-crisis levels in March
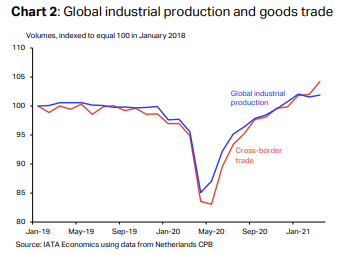
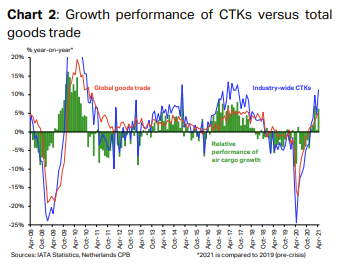
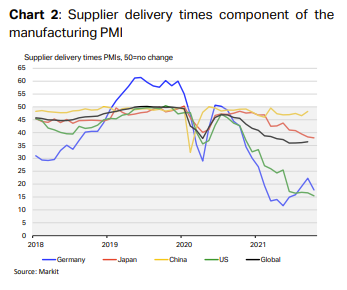
- Cross-border goods trade reached a new high in March 2021 (up 4.2% vs March 2019), with industrial production also elevated and growing (Chart 2)
April – June 2021
- Pandemic-related supply chain disruptions and resulting delivery delays continue to benefit air cargo
- The blockage of the Suez Canal this March will further exacerbate the supply chain bottlenecks and might be reflected in next month’s data on some routes since air and ocean compete for certain goods.
- International cargo volumes of Middle Eastern carriers rose by 8.8% compared with the pre-crisis period and 6.8% vs. January.
- In April, industry-wide available cargo tonnekilometres (ACTKs) were 9.7% below their levels of April 2019
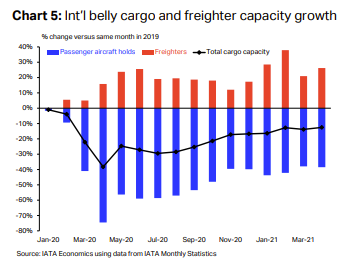
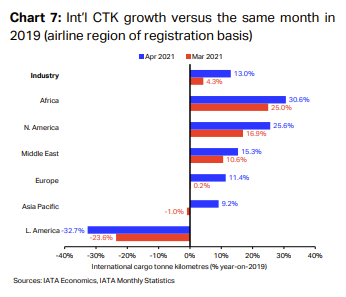
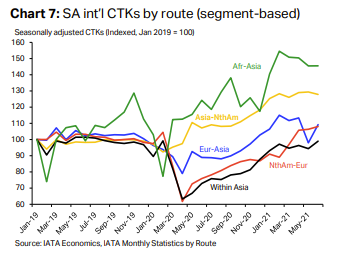
- Airlines based in Africa posted a fourth consecutive month of growth at or above 25% versus 2019. (chart 7)
- Air cargo continued to perform well in May 2021, as industry-wide cargo tonne-kilometres (CTKs) rose by 9.4% compared to pre-crisis levels in May 2019.
- Airlines registered in the Middle East, Europe and Asia posted growth performances that were more in line with the international total but improved significantly in April compared to March.
- The latest data shows global goods trade grew by 5.2% in April 2021 versus April 2019. Periods during which CTKs grow faster than other modes of transport are typical at the start of economic upturns. (Chart 2)
July – September 2021
- Airlines based in North America saw growth in their international CTKs remain stable in May at 25.5%.
- Air cargo trends were still strong in July. Industry-wide cargo tonne-kilometres (CTKs) increased by 8.6% compared to July 2019, slightly below the growth outcome for June (9.2%).
- The consequence is a small slowdown in international CTKs growth for airlines in the Middle East, Europe and Asia Pacific. They grew by respectively 14.1%, 5.7% and 5.3% in May 2021 versus May 2019.
- Carriers based in the Middle East posted a 17.1% increase in their international air cargo volumes in June 2021 vs June 2019.
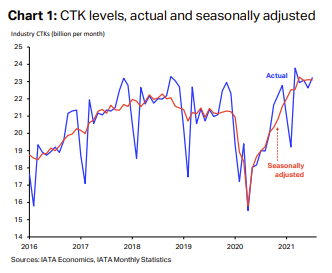
- Seasonally adjusted (SA) CTKs have flatlined in the past three months, with a month-on-month fall of 0.1% in July (Chart 1)
- Delta variant gripped global supply chains. In South East Asia and China, COVID-19 outbreaks – accelerating in late-July – led to strict restrictions.
- International CTKs growth of carriers based in the Middle East moderated in July, to 11.3% compared to July 2019 after a 15.8% increase in June.
- Airlines based in North America topped the international growth chart this month, with international CTKs up 20.5% compared to July 2019
- A record-high value for any months of July, showed that the market remains exceptionally tight.
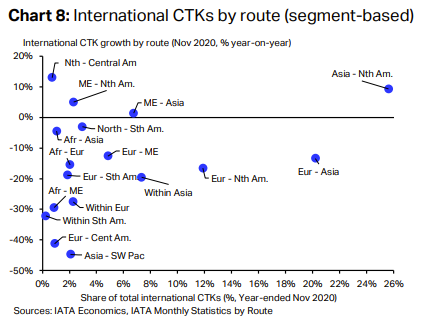
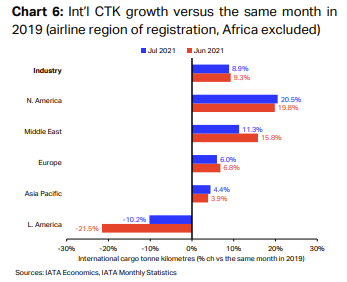
- International cargo tonne-kilometres increased by 8.9% in July 2021 vs July 2019, down from 9.3% in June except in the Middle East where there was a moderate slowdown to 11.3% in July 2021 vs July 2019, and in Latin America, where traffic improved (Chart 6).
- August was the fourth consecutive month of relative stability in air cargo. Industry-wide cargo tonne-kilometres (CTKs) rose by 7.7% vs. August 2019, compared with an 8.8% expansion in July.
- Cargo capacity improved in September, but is still 8.9% below 2019 levels.
October – December 2021
- One of the main challenges to further economic growth is a severe global supply chain congestion resulting from pandemic restrictions.
- Factory closures and staff quarantines have led to transport delays and input shortages, which have been adversely impacting businesses through higher cost of materials.
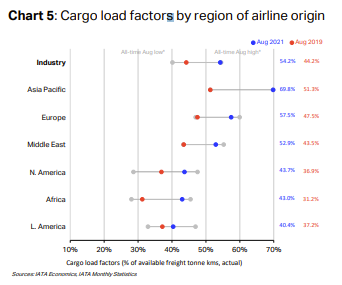
- Cargo load factors remained elevated across all regions and were the highest in Asia Pacific. (chart 5)
- The recovery in international capacity remained slow due to still subdued international passenger market.
- The region’s growth was boosted by cargo traffic on Middle East-Asia segment-based routes (+16.4% in August vs. August 2019).
- Unusually low values in the supplier delivery times PMI, The metric reached an all-time low in the US in October (15.45), and globally in June, at 35.95 (Chart 2)
- Indeed in August, travel restrictions and airport closures related to Delta outbreaks in China led to a fall in capacity, which was partly reverted in September (chart 4)
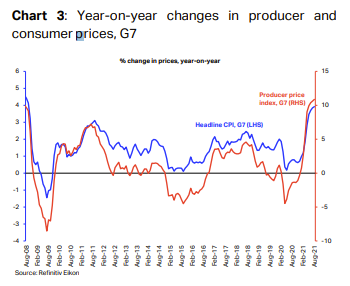
- Consumer prices inflation for all items was at 4.3% in September, the highest increase since 2008 (Chart 3).
- Asia Pacific faced a mixed bag of supply chain disruptions, slowing manufacturing activity in China, but improving cargo capacity. But the load factor remains the highest among the regions at 76.3%, and international ACTKs are still 21.7% below September 2019 levels
This is the logistics air freight and ocean freight summary report for the year 2021, which provides an overview of the whole logistics and shipping challenges that have occurred during the previous year.